Dr Soroosh Sharifi

Associate Professor in Water Engineering

School of Engineering, University of Birmingham

Adaptive, low-carbon, data-driven water solutions for a changing climate.

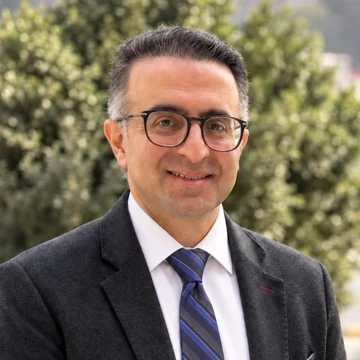
Portrait of Dr Soroosh Sharifi

I am a water engineer with over 25 years of experience in different areas of the engineered water cycle, from hydrology (rainfall-runoff modelling, flood and streamflow forecasting, groundwater age) to hydraulics and hydraulic structures (open channels, pipes, rivers, sediment transport and scour), water and wastewater treatment (coagulation and flocculation, desalination, anaerobic reactors, activated sludge) and environmental engineering (stormwater pollution, coastal water quality, circular plastics).

The research questions I am interested in answering are:

  • How will the pipes, drains, channels and structures we depend on behave under a changing climate and changing loads, and how can they be made resilient?
  • How can water be treated, reused and recovered with far less energy, carbon and chemicals, working with natural processes wherever possible?
  • How far can we trust our predictions, and how can data, physics, machine learning and AI together support better decisions under uncertainty?

My research aims to help make water systems more sustainable, resilient and data-driven, contributing directly to the United Nations Sustainable Development Goals on clean water and sanitation (SDG 6), sustainable cities and communities (SDG 11) and climate action (SDG 13).

To achieve this, I combine physical experimentation with computational and data-driven methods. My work includes experiments at facilities such as the National Buried Infrastructure Facility (NBIF), alongside numerical and analytical modelling. I use Bayesian and statistical methods to understand uncertainty and variability, evolutionary computation to explore and optimise complex systems, and deep learning and computer vision to extract insight from experimental and operational data.

Research

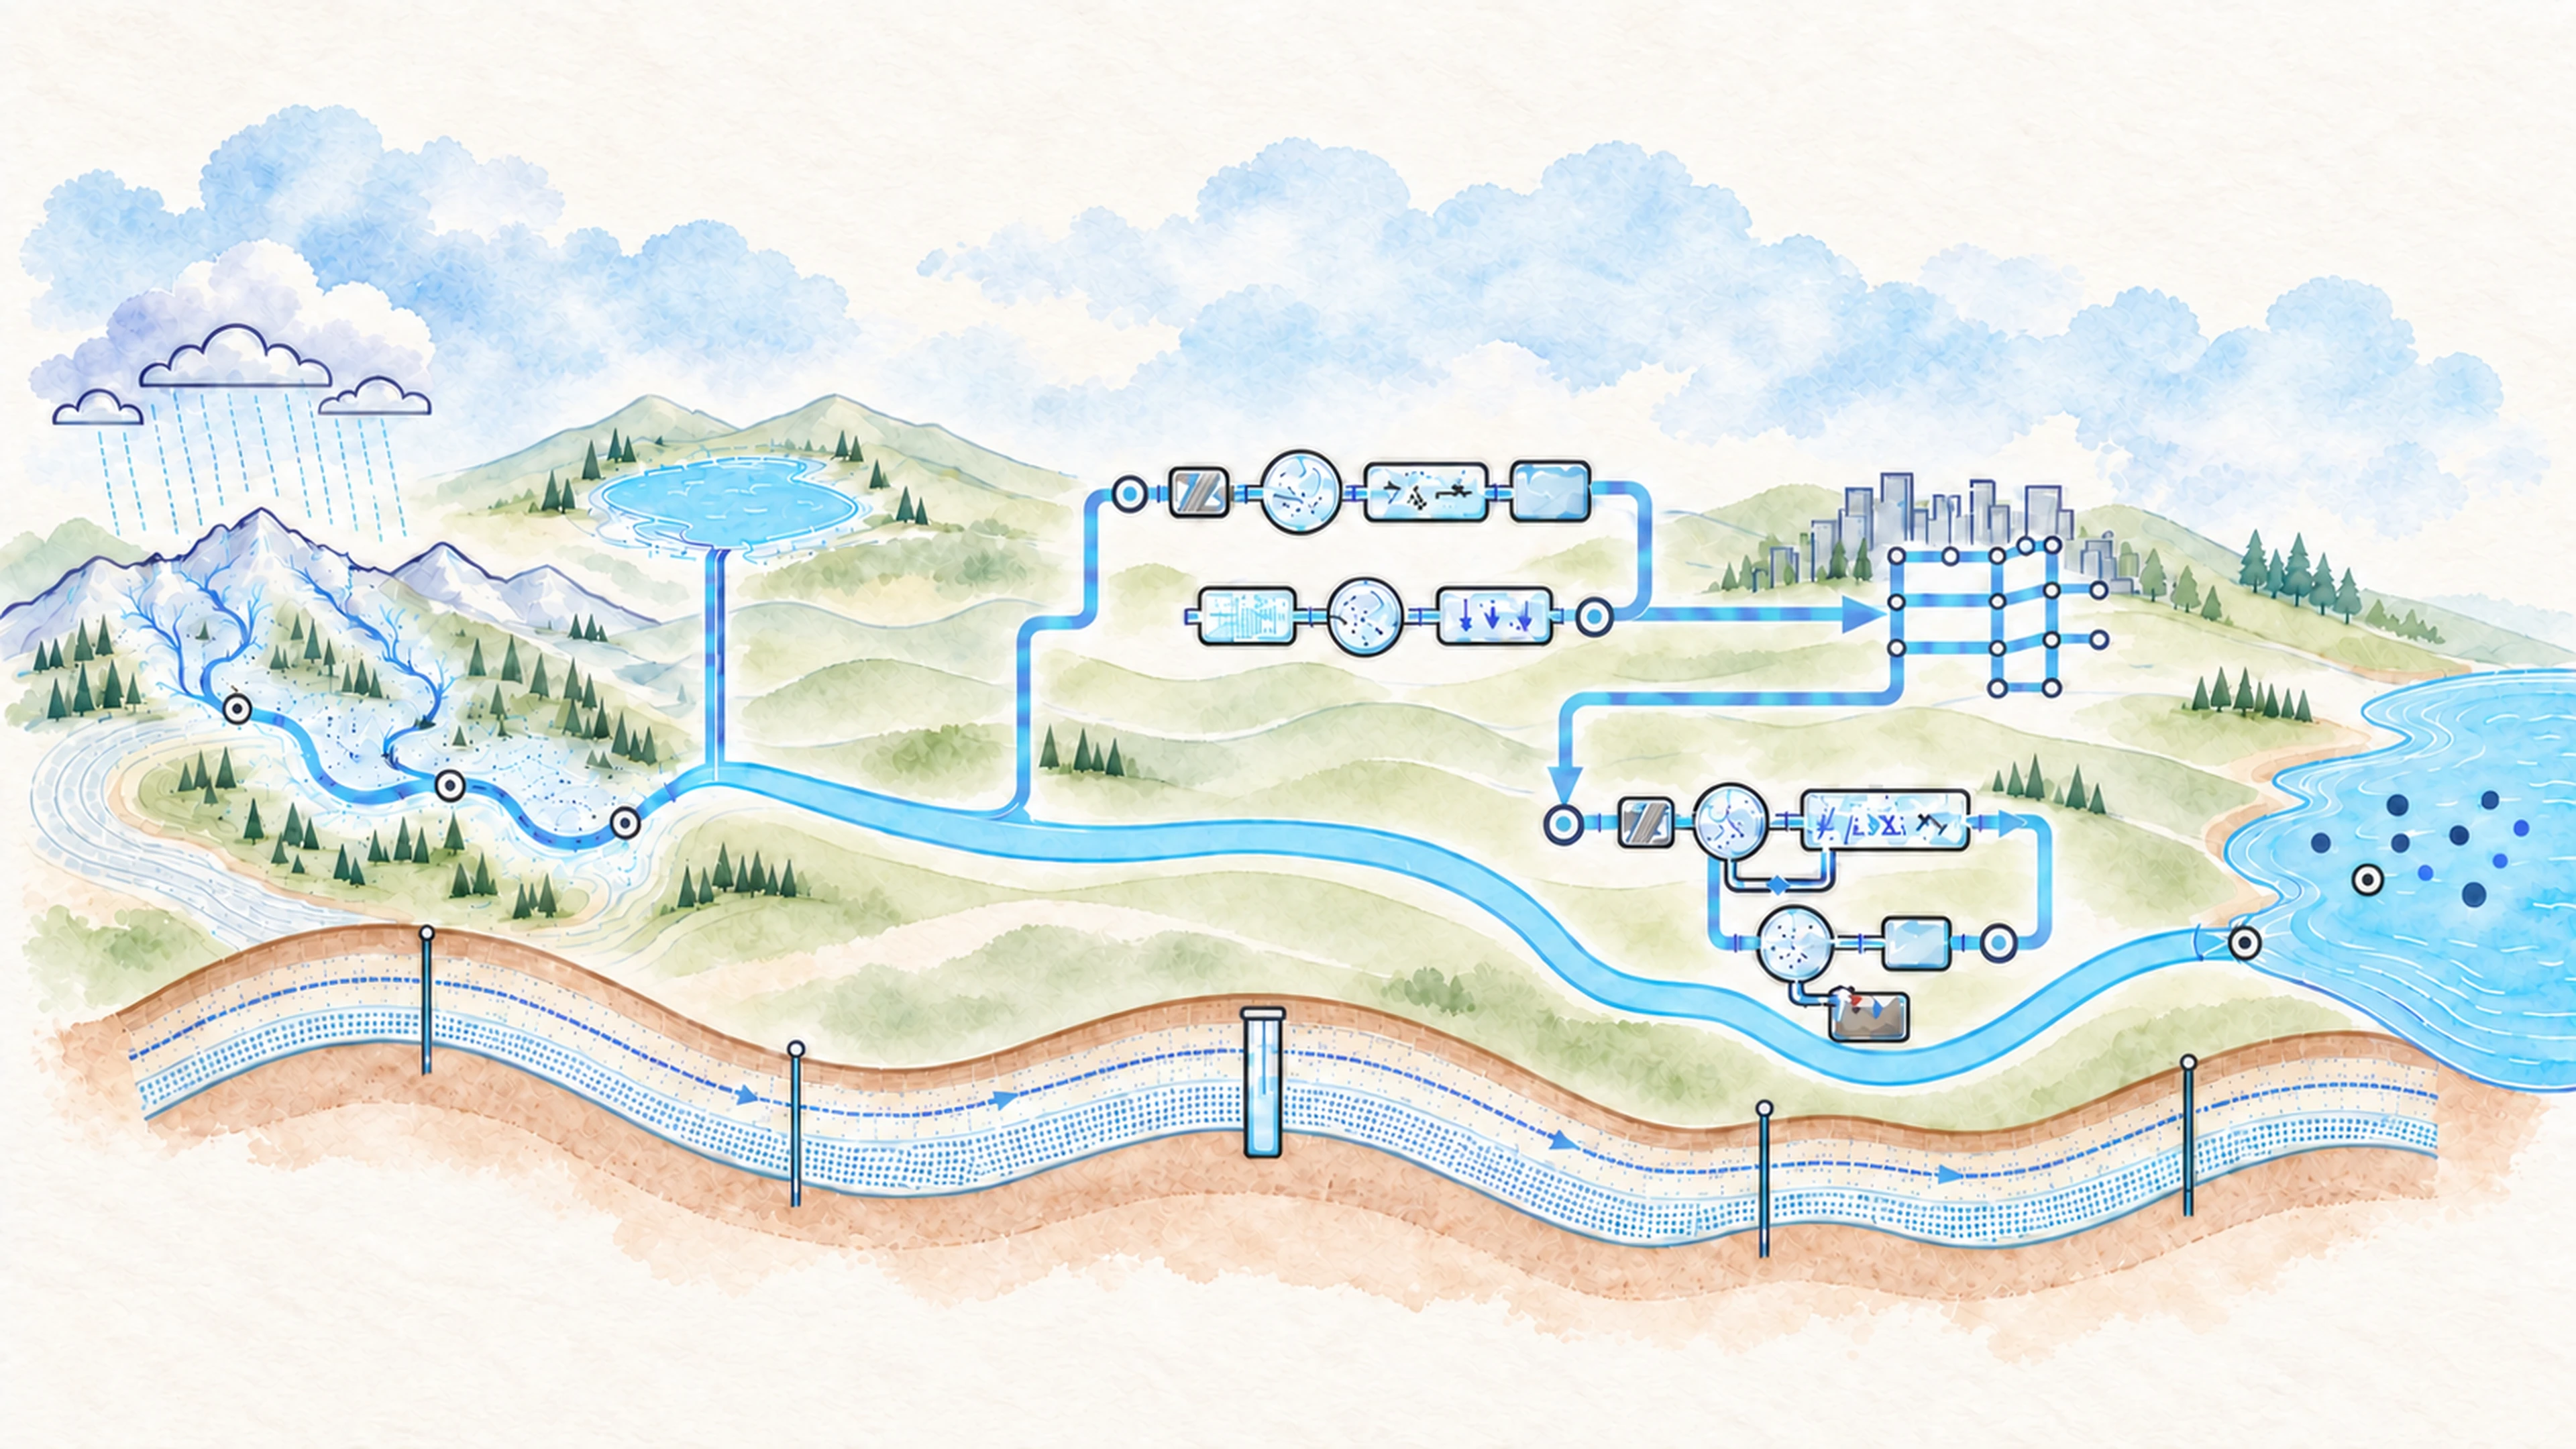
The engineered water cycle.
One system. Many questions.

Scroll to move through the sequence.

Go to Laboratory
0%
Redefine koi paths · edit CSV

Loading artwork…

Hydrology

How quickly catchments respond to rainfall, how rain becomes river flow and how floods and streamflow can be forecast more accurately.

  1. What equations best estimate how quickly a catchment responds to rain in a given region?

    To pick the best time-of-concentration equations for a region, we proposed correcting each equation to reduce its bias there. Reference values came from the NRCS velocity method in TR-55, and we tested the approach on 72 watersheds and subwatersheds in Khorasan Razavi province, Iran.

    • Three equations performed best for these watersheds: California (correction factor 1.715), Kirpich (Tennessee, 1.721) and Arizona DOT (1.126).
  2. Can real-time rainfall data and satellite images improve flood and streamflow forecasts?

    We tested real-time updating of rainfall threshold curves on the Walnut Gulch watershed, using a rainfall-runoff model and a neural network. In a second study we built ANFIS and ANN models for long-term streamflow in the Talezang basin, Iran, using in-situ records, MODIS snow cover and a seasonal parameter.

    • Updating raised the average hit rate by 28% and cut the false rate by 51%.
    • Seasonal and satellite data had a great impact on accuracy, and ANFIS outperformed ANN.
Hydraulics

How does water move through rivers and channels and around structures? How can we better understand the underlying physics, channel capacity, velocity and shear, sediment transport and scour at bridge piers?

  1. Can evolutionary algorithms improve predictions of how much flow rivers and channels can carry?

    We applied the NSGA-II evolutionary algorithm to two open-channel modelling problems. In one, we calibrated the Shiono and Knight depth-averaged model and studied how friction factor, eddy viscosity and a secondary-flow term vary across trapezoidal channels. In the other, we automated calibration of a quasi 2-D model on seven rivers, where it compared favourably with an expert user's traditional calibration.

    • Rules link friction, eddy viscosity and secondary flow to the wetted parameter ratio.
  2. How are velocity and boundary shear stress distributed across channels of different shapes?

    Using a genetic algorithm, we built a simple model for lateral velocity in compound channels, fitted to several flumes and the river Severn. For partially filled circular pipes we used the Shiono and Knight quasi-two-dimensional model, calibrated on laboratory experiments. For boundary shear stress in smooth trapezoidal and circular channels, we applied a face recognition technique.

    • The compound-channel model had 11.2% less error on average than the vertical divided channel method.
    • Shear stress predictions had a cross correlation coefficient above 92%.
    • Circular-pipe discharge errors averaged 3.6%, and reached 5.7% at the lowest depth.
  3. How can the end-depth ratio at a channel's free overfall be predicted?

    Genetic programming, applied to experimental data from flat-bed circular channels, gave us an expression for critical depth and the end-depth ratio at a free overfall. Separately, we asked which variables link end depth to critical depth in rectangular channels, using principal component analysis.

    • The expression outperforms others for critical depth and suits any cross-section.
    • Width, end depth and the square roots of bed and critical slope emerged as primary variables.
  4. How can bedload sediment transport be simulated reliably, including where flow meets dry ground?

    We extended a second-order wave propagation algorithm to couple the shallow water equations and bedload transport in two dimensions. An augmented Riemann solver let us model wet/dry fronts, including dam failure by overtopping. We also solved the system with coupled and splitting approaches, and compared two sand sliding methods in OpenFOAM.

    • The solver handled every flow regime we tested, dry interfaces included.
    • The coupled scheme worked at a Courant number of 0.6 and the splitting scheme at 0.3.
    • The artificial transport rate method took longer but kept mass continuity error under 0.2%.
  5. How deep does scour become around bridge piers and piles when the sediment bed is mobile?

    Our 3D model couples flow with bedload and suspended-load transport, tested on scour around circular, square and diamond piers. A second model compared flow and live-bed scour around square and diamond piers. We also used a coupled OpenFOAM model to simulate scour around two side-by-side piers at three spacing ratios.

    • Scour depth came within 13.1% of measurements for all three shapes.
    • Quasi-equilibrium scour reached 1.94 projected pier widths for the square pier and 1.00 for the diamond.
    • Scour depth fell as the spacing between piers grew, and we derived an equation for equilibrium depth.
  6. How well do existing methods compute the rise in water level caused by bridge constrictions?

    We reviewed methods for computing backwater depth due to bridge constrictions, including one- to multi-dimensional models, finite difference approaches and artificial intelligence methods. We then compared the one-dimensional methods with each other, since they are widely used with experimental and field datasets.

    • WSPRO significantly overestimated afflux and Yarnell's method underestimated it.
    • Measured afflux came closest to the energy and momentum methods.

Groundwater

Water held underground: how old it is, judged from environmental tracers, and how its quality varies across a region.

  1. How can environmental tracers reveal the age of groundwater, and how certain are the estimates?

    We built a Bayesian model that estimates groundwater age from radioactive isotopes and anthropogenic chemicals, and applied it to a hypothetical aquifer and to data from La Selva Biological Station. In a second study we estimated the age distribution as a free-form histogram, using Bayesian Markov chain Monte Carlo, and tested it on tracer data from Holten and La Selva.

    • At La Selva the young fraction was 15% to roughly 60%, most likely 30%.
    • Old groundwater was much less certain, at 20,000 to 200,000 years.
    • Standard mathematical age distributions fitted the tracers better than histograms, whose bins were poorly constrained.
  2. How does groundwater quality vary across a region made up of several catchments?

    We analysed groundwater monitoring data recorded twice a year from 2015 to 2018 at 12 observation wells in a data-poor catchment in the Bursa region of Turkey. Quality indices, including the water quality index, and Piper, Durov and Wilcox diagrams showed how quality varies across the area and whether human activity affects it.

    • Groundwater quality was generally suitable for irrigation, though samples differed across the area.
    • The water was predominantly alkaline, with bicarbonate and calcium the main ions, pointing to rock dissolution.
    • Disturbances in electrical conductivity indicate possible pollution from human activity and climate change.

Water treatment

Sustainable and low-cost water treatment processes: how flocs form and settle, how imaging and machine learning can predict their behaviour, how plant-based coagulants can replace chemicals and how desalination can use less energy.

  1. What can non-intrusive imaging reveal about the size, strength and settling of flocs?

    Using particle image velocimetry and non-intrusive imaging, we tracked large Al-kaolin aggregates as they settled, and found speeds 2 to 14 times below those predicted for perfect spheres. We then measured aggregate strength by intrusive and non-intrusive methods, and fitted a one-parameter kinetic model to the aggregate size distribution during flocculation, in bench and pilot-plant tests.

    • Settling speed showed no strict dependence on size, shape or density.
    • Aggregates formed at higher shear rates resisted breakage better.
    • The kinetic model tracked aggregate size distributions with errors averaging about 5%.
  2. Can machine learning predict how fast flocs settle from their physical features?

    We trained machine learning models to predict how fast fractal aggregates settle from their physical features. Particle image velocimetry and high-speed imaging in a sedimentation column gave the data for two fuzzy approaches, a fuzzy model and a physics-informed fuzzy symbolic regression. We also compared gradient boosting with and without physics-based features.

    • The fuzzy model reached R² = 0.923, with margination, radius and clumpiness the strongest predictors.
    • Physics-based features raised gradient boosting accuracy from R² 0.887 to 0.951.
    • The physics-informed symbolic regression reached R² above 0.99, against 0.56 to 0.63 for models using morphology alone.
  3. Can image analysis and deep learning model and forecast flocculation in water treatment?

    From non-intrusive images of flocs in three-hour batch tests at two velocity gradients, we compared MLP, LSTM and ARIMA models for predicting floc evolution. We then trained eight attention-enhanced hybrid deep learning models on 4300 floc images to forecast the evolution of the aggregate size distribution 24 time steps ahead, and reviewed image-based machine learning as a route to automation.

    • LSTM predicted the number of flocs accurately across all groups and velocity gradients.
    • ARIMA was unsuitable for predicting the number of flocs.
    • The best multi-step model reached R² = 0.943 with a 2.35% error.
  4. Can plant-based coagulants such as kenaf seed replace chemical coagulants in drinking water treatment?

    After reviewing plant-based coagulants for removing natural organic matter and turbidity, we tested three kenaf seed extracts on high, medium and low turbidity water. We then fractionated the seed proteins into albumin, globulin, prolamin and glutenin and tested each as a coagulant.

    • The hexane extract removed over 90% of turbidity in high turbidity water, the saline extract in medium.
    • The globulin fraction outperformed the other products and also worked as an aid to aluminium sulfate.
  5. How can microplastics be removed from drinking water during coagulation and filtration?

    To remove microplastics, we compared Moringa oleifera seed extract with alum in direct and in-line filtration, spiking synthetic water with aged PVC particles and humic acid. In two further studies, one using Moringa as the coagulant, we compared ballasted flocculation with conventional flocculation, following floc growth and settling by non-intrusive imaging.

    • At pH 6, Moringa extract and alum removed 98.5% and 98.7% of the microplastics.
    • In-line filtration matched direct filtration, so flocculation was unnecessary.
    • Ballasted flocculation removed 99.6% of PVC microplastics in 6 s; conventional flocculation took 3.5 min for 78.2%.
  6. How can desalination be made more efficient and powered more sustainably?

    We measured feed pressure in hybrid semi-batch/batch reverse osmosis under a new configuration, with the work exchanger upstream of feed mixing. To power desalination, we weighed solar, wind and wave potential with multi-criteria decision analysis to site an offshore energy island on the Red Sea coast.

    • Upstream placement saved 8% of energy with current membranes, potentially 12% with future ones.
    • The central Red Sea suited best, and available renewables could meet the 2.1 million kW demand.

Water transition

Carrying treated water to users: leakage in distribution networks and transient flow in pipes.

  1. How can leakage in water distribution networks be assessed experimentally?

    We built an outdoor test set-up with uPVC pipes and artificially induced leakage points to relate pressure drops to the amount of leakage. From the measurements we proposed a dimensionless model for predicting where a leak is and how much water it loses.

    • Pressures throughout the system were affected by leakage, with the largest drops near the leak.
    • Pressure drop and relative flow followed an exponential relationship, which the experiments validated.
  2. How can transient flow in pipes be approximated in two dimensions?

    We solved two-dimensional water hammer with a second-order accurate Godunov-type finite volume method, adding k-ε and k-ω turbulence models for unsteady friction. We tested it against experimental data from one low and one high Reynolds-number turbulent case.

    • Including the convective inertia terms gave more accurate pressure profiles.
    • With a CFL number close to unity, both turbulence models gave reasonable and acceptable predictions.

Wastewater treatment

Treating used water: uncertainty in activated sludge models and how flow behaves inside anaerobic baffled reactors.

  1. How uncertain are the parameters of activated sludge models, and how can that uncertainty be quantified?

    Activated sludge models have many stoichiometric and kinetic parameters, and we estimated them probabilistically with a Bayesian hierarchical framework and Markov chain Monte Carlo. Priors came from expert knowledge and literature, and the output is a joint probability density function of the parameters. We illustrated it with ASM1 on synthetic data from a hypothetical treatment system.

    • Full-scale data can narrow some parameter ranges substantially.
    • For others, large correlations or low sensitivity leave little information.
  2. How has the flow inside anaerobic baffled reactors been modelled?

    We systematically reviewed numerical and physical modelling of anaerobic baffled reactors, selecting articles from 1990 to 2024 in Scopus and Engineering Village that used computational fluid dynamics and statistical models.

    • 75% of the studies used multi-chamber reactors with vertical baffles and validated models on low-concentration wastewater.
    • Only 25% made significant changes to the experimental models.
    • Half used CFD for hydrodynamics without integrated biochemical reactions.

Environment and pollution

Where water ends up: stormwater pollution and its sources, coastal and tidal waters, and plastic waste.

  1. How can urban stormwater pollution be traced to its sources and its movement predicted?

    A Bayesian chemical mass balance model let us trace heavy metals in runoff at two Anacostia River outfalls in Washington, DC back to their sources. For highway runoff in California, we fitted build-up and wash-off models to pollutographs, searching for model structures with multi-objective evolutionary methods.

    • Traffic-carrying paved surfaces were the major source of metals, and roofs gave up to 50% of the lead.
    • The wash-off models agreed acceptably with observed data.
  2. How large should stormwater treatment be to capture the polluted first flush of runoff?

    Applying Monte Carlo simulation, we assessed how the stormwater volume captured by treatment changes how often discharge concentrations exceed threshold limits. We modelled the first flush as a power law between cumulative load and flow, with a random exponent whose distribution came from 78 pollutographs measured at three urban highway sites in West Los Angeles.

    • The effect of captured rain depth is site-specific.
    • Capture requirements can be set by weighing the chance of exceeding limits against economic factors.
  3. How can conditions in coastal and tidal waters be monitored and forecast?

    To forecast coastal water quality, we coupled high-resolution hydrodynamic simulations with machine learning and optimisation, giving an accurate and computationally efficient tool. To monitor a shallow tidal stream, we ran a Fluvial Acoustic Tomography system, which uses acoustic travel times, with moving-boat ADCP surveys as the reference.

    • Acoustic velocity and flow direction agreed remarkably well with ADCP section averages.
    • Velocities read high when the acoustic stations sat in the cooler freshwater layer.
  4. What would help African countries move towards a circular plastics economy?

    We first analysed plastic value chains in Africa, looking at the plastic waste trade, the digital solutions entrepreneurs have adopted, and case studies. We then applied thematic analysis to qualitative data from engagements with 69 circular economy stakeholders in five countries.

    • Entrepreneurs apply web-based solutions, mobile apps and 3D printing.
    • Niche innovations are advancing, but little change at regime level slows the transition.
    • Policy innovation and regulatory change are needed, including extended producer responsibility.

Sustainability

Making water systems sustainable: how to assess the sustainability of water resources management, where to harvest rainwater and how decentralised rainwater and greywater systems perform in arid and semi-arid regions.

  1. How can the sustainability of water resources management be assessed in arid and semi-arid regions?

    Reviewing 17 existing studies, we found that none of the assessment tools was fully applicable to arid and semi-arid regions. We then developed a conceptual framework of four components (environment, economy, society and infrastructure) and 24 indicators, and refined it through two Delphi rounds with expert stakeholders from the Gulf Cooperation Council countries.

    • Stakeholders preferred equal weights for the social, economic and infrastructure indicators.
    • The refined framework has 17 indicators, down from 24.
  2. What locations suit rainwater harvesting in arid and semi-arid regions?

    Our systematic review of 68 studies found that every existing framework for ranking rainwater harvesting sites ignores ecological impacts. We then extended these frameworks with ecological criteria, weighted using data analysis and expert opinion, and applied the hybrid framework to site selection in Erbil Province, Iraq.

    • Adding ecological criteria changed the ranking of the sites in Erbil Province.
    • 41% of frameworks used biophysical and socioeconomic criteria, 59% biophysical criteria alone.
  3. How sustainable are decentralised rainwater and greywater systems in dry regions?

    To see how decentralised hybrid rainwater and greywater systems are assessed for sustainability in arid and semi-arid regions, we systematically reviewed 40 studies from Scopus and Engineering Village and developed a framework with environmental, economic and social indicators.

    • Hybrid systems can ease pressure on centralised supply, add dry-season water and lower flood risk.
    • A full sustainability framework for these systems in dry regions had been little explored.

Laboratory (opens in a new tab)

Testing infrastructure at near full scale under changing climate and loads.

I lead environmental research at the National Buried Infrastructure Facility (NBIF) (opens in a new tab).

Examples include:

  • Drainage

    Design and testing of new materials and configurations for urban and infrastructure drainage under future climate and loading scenarios, supported by forensic study of drainage asset failure and drainage digital twins.

  • Water and wastewater transmission

    Physical and numerical testing of buried pipe displacement failure under different flood and soil-moisture conditions, and development of advanced hybrid soil-water-infrastructure interaction models that predict risk at different spatial and temporal scales.

  • Environmental change

    Assessing how cyclic temperature variation, such as freeze and thaw, affects above-ground and subsurface infrastructure, using the walk-in environmental chamber with its controllable temperature and humidity.

For enquiries, and to discuss research and industry collaborations, please get in touch.

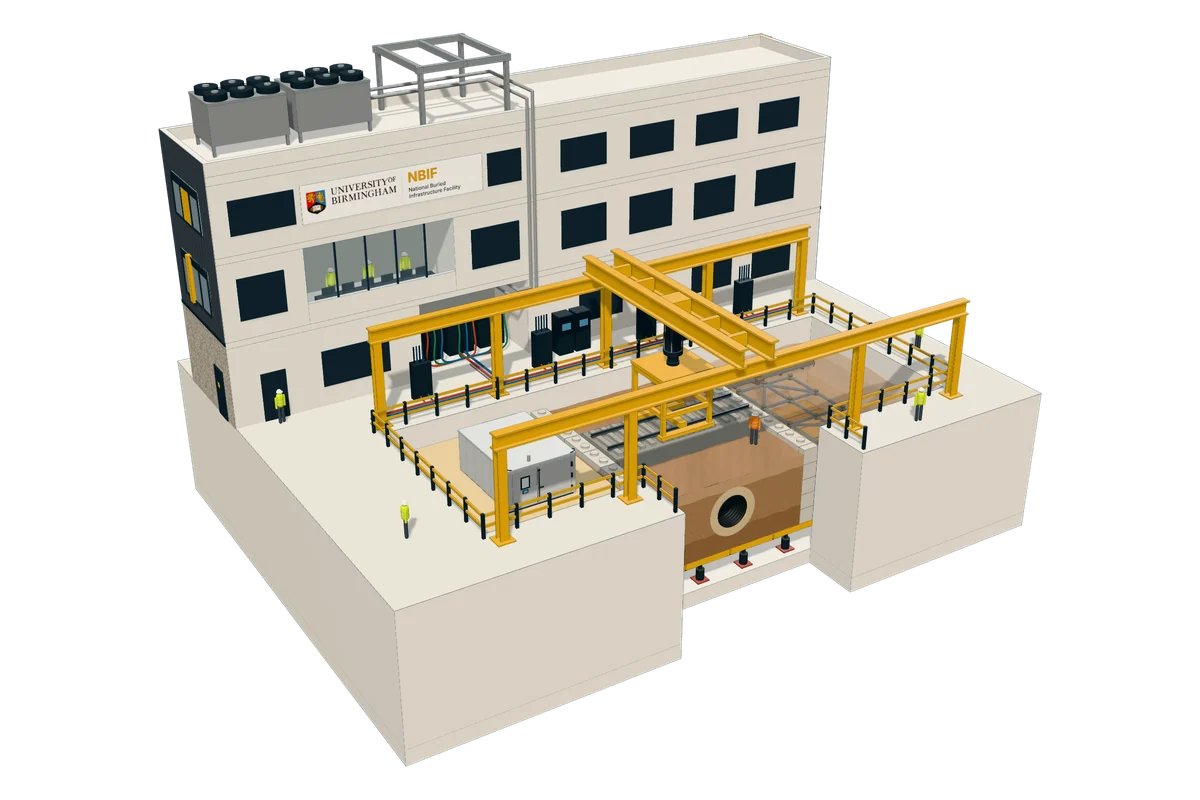
Cutaway model of the NBIF test hall. A 25 metre soil test pit is divided into three bays by concrete block walls. A yellow steel frame with one large actuator stands over a rail track in the middle bay; the cut face shows a buried pipe under the track and the moving floor at the base of the pit. A walk-in environmental chamber, with controllable temperature and humidity for freeze-thaw and tropical climates, stands on a bed of sand in the left-hand bay, and a pipe network, fed from a main along the back wall, shows buried in translucent soil in the right-hand bay. The hydraulic plant runs along the back of the pit, with the control and plant building behind it, carrying the University of Birmingham and NBIF sign, and chillers on its roof. People in the hall wear high-visibility jackets and hard hats.
  1. 1Soil test pitThe pit is 25 m long, 10 m wide and 5 m deep.
  2. 2Hydraulic moving floorSpecially designed actuators in the central third of the pit can move up or down by 30 cm to simulate different ground movements and soil profiles.
  3. 3Buried pipeA pipe under test is buried beneath the track, which shows how loading from above reaches it.
  4. 4Rail track sectionA section of rail track on the soil is loaded from the frame above, so rail loading reaches the ground and the pipe below.
  5. 5ActuatorOne large actuator on the loading frame presses down on the track and can apply both static and dynamic loading.
  6. 6Concrete block wallsInterlocking concrete blocks divide the pit into three bays, so different test set-ups can share one pit.
  7. 7Environmental chamberThe walk-in chamber has controllable temperature and humidity, for testing materials and pipes under freeze-thaw and tropical climates.
  8. 8Pipe networkA buried pipe network with junctions tests water, wastewater and drainage pipework as a system.
  9. 9Mains connectionA main fixed along the back wall of the pit feeds the pipe network through a gate valve.
  10. 10Hydraulic service manifoldsDistribution blocks share the hydraulic supply between the actuators and the moving floor.
  11. 11Hydraulic hardlineRigid pipework carries hydraulic oil from the power units to the manifolds and the actuators.
  12. 12ControllersElectronic controllers command the actuators and the moving floor, so a loading pattern can be repeated exactly.
  13. 13Hydraulic power unitsPumps and tanks in the plant room supply the hydraulic pressure for the actuators and the moving floor.
  14. 14Control roomOperators in the control room run the tests and monitor how each set-up responds to the loading.

Education

Teaching and supervising water engineers.

I deliver various water engineering and data science modules to undergraduate and postgraduate students on our Edgbaston and Dubai campuses, and supervise PhD and MSc research across water engineering.

What I currently teach

  • Surface and Groundwater Hydrology

    Undergraduate, year 3

  • Water Transmission and Treatment

    Undergraduate, year 3

  • Open Channel Flow Hydraulics

    Undergraduate, year 2

  • Management Information Systems and Simulation

    MSc

PhD and MSc supervision

Supervised projects have covered

  • Wastewater treatment
  • Remote sensing for water resources
  • Water harvesting and reuse in dry regions
  • Renewable-powered desalination
  • Natural coagulants for water treatment
  • Scour and sediment in aquatic environments
  • Sustainable water resources management
  • Vegetation and flow in open channels

I welcome enquiries from prospective PhD students, and from postdoctoral and visiting researchers whose interests fit these areas.

If you are thinking of applying, email me first with your research interest, your degree and results, how you plan to fund your study and your CV.

How to apply for a PhD (opens in a new tab)Postgraduate research at Birmingham (opens in a new tab)

Contact

Get in touch.

I welcome enquiries from collaborators, industry partners and researchers, and about teaching and PhD study.

Telephone
0121 414 5100